How much?
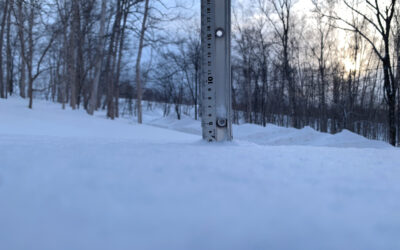
For the last 5 seasons every morning the 360niseko team have gone outside, taken a shot of the 360niseko snow station, checked the temperature, cleared the snow off, recorded the readings and produced our daily snow reports. Back in 2011-12 it was astounding to visualize on a daily basis just how much snowfall came down lending credence to Niseko being one of the snowiest regions on the planet. We recorded a whopping 15.3m of accumulative snowfall in that first season!
2014-15 Season
Total:
1181cm
The stand out month was December with 519cm which accounted for almost half the accumulative snowfall for the entire season!
2015-16 Season
Total:
1041cm
Last season was a slow start but we received some solid dumps mid December which set us up for a huge last week of the month leading into JAPANUARY – which translates to lots of powder! Despite the overall accumulative total being down on the previous years it was still a solid season with consistent snowfall over then entire season rather than huge dumps followed by long “dry” patches.
5 years of 360niseko Snowfall Data
As we state in the snow report disclaimer we don’t claim that our figures are definitive but rather representative of what is on the ground outside our front door where we have been based in Niseko.
Here are the locations:
2011-12 Season Middle Hirafu Village – Altitude 247m – Accumulative Total: 15.3m
2012-13 Season Lower Hirafu Village – Altitude 206m – Accumulative Total: 15.8m
2013-14 Season Middle Hirafu Village – Altitude 226m – Accumulative Total: 12.2m
2014-15 Season Middle Hirafu Village – Altitude 226m – Accumulative Total: 11.8m
2015-16 Season Middle Hirafu Village – Altitude 226m – Accumulative Total: 10.4m
This year the 360niseko snow station has been moved to a new location between Hirafu and Higashiyama at 200m in altitude. For reference here are some altitudes across Niseko United and beyond:
Niseko Hanazono Base 301m
Grand Hirafu Hirafu Gondola Base 306m
Niseko Village Base 290m
Niseko Annupuri 401m
Niseko Moiwa 340m
Chisenupuri 549m
The 2016-17 Outlook?
For this years outlook we sought professional advise from advanced statistician Dr Tony Carter who reviewed our data came up with the following synopsis:
I’ve nominally called 1 November the start of the season, and put 30 day intervals to roughly mark months through to the end of March (+150 days) from the start of the season. So by mid-December (+45 days) you’ll have a pretty good indication of the sort of season you’re in for.
There may be something forming regarding La Nina as per below. From 2011/12 to 2015/16 we have been trending through the spectrum from La Nina (in dark blue) to El Nino (in dark red). Given the BOM has us on a on a La Nina Watch, I’m tipping 13.0 metres for 2016/17
Heroic Snowfall
This is what’s coming!!!

Snow fall depth in Hirafu village, 19 December 2012


